This is the latest release. View previous releases.
The data are not being used to support government policy.
This page is part of the latest crime collection
This is not the latest | view the latest crime collection
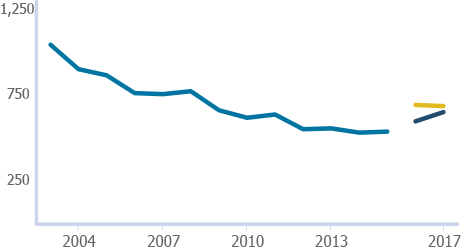
Increases evident in police recorded offences involving a knife or sharp instrument for the third year
England and Wales, year ending March 2011 to year ending December 2017
Source: Police recorded crime, Home Office
Notes:
Crime in England and Wales: Additional tables on Fraud and Cybercrime
Released: 19 July 2018
Estimates from Crime Survey for England and Wales (CSEW) on fraud and computer misuse.
Crime in England and Wales: Appendix Tables
Released: 19 July 2018
Trends in Crime Survey for England and Wales (CSEW) crime experienced by adults and children aged 10 to15 and Home Office police recorded crime, by offence type.
Fraud data is provided by Action Fraud – the public-facing national fraud and cybercrime reporting centre, as well as two industry bodies, Cifas and UK Finance, who report instances of fraud where their member organisations have been a victim.
Further information on each of the Fraud data sources and the differences between them can be found in Section 5.4 of the User guide to crime statistics for England and Wales and also in the Overview of fraud and computer misuse statistics article.
Although the deaths at Hillsborough occurred in 1989, an inquest returned a verdict of manslaughter and therefore was recorded as a homicide in the year 2016.

Large rises in the cost of crude oil have fed through to prices paid by consumers at the pump. Air fares and ferry prices also contributed to the overall increase in inflation due to the timing of Easter. This has been partly offset by the price falls in computer games and energy costs rising less than this time last year.
Mike Hardie, Head of Inflation, ONS
Index of Production (IoP)
Movements in volume for the UK production industries: manufacturing, mining and quarrying, energy supply, and water and waste management.
Index of Services (IoS)
Monthly movements in output for the services industries: distribution, hotels and restaurants; transport, storage and communication; business services and finance; and government and other services.
Output in the construction industry
Dataset | Released on 11 June 2018
Monthly construction output for Great Britain.
Retail Sales Index (RSI)
A first estimate of retail sales in volume and value terms.
This component is used for one piece of information at a time like a link to more content
Over the long-term, crime has fallen, but some crimes have risen slightly in the previous 12 months
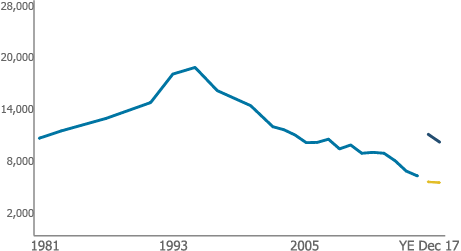
Data on this chart refer to different time periods.
1981 to 1999 refer to crimes experienced in the calendar year (January to December); and from year ending March 2002 onwards the estimates relate to crimes experienced in the 12 months before interview, based on interviews carried out in that financial year (April to March).
Little change in levels of violent crime in recent years

Police recorded crime data are not designated as National Statistics.
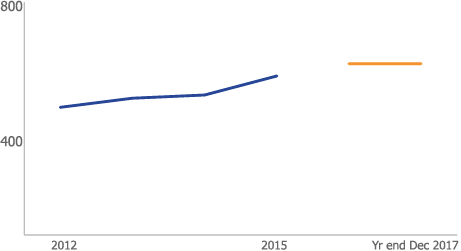
Police recorded 7,130 (22%) more crimes involving weapons, with knife crime in cities rising most

Police recorded crime data are not designated as National Statistics.
No change in the volume of fraud offences in the last year
Police recorded crime data are not designated as National Statistics.
Over the long-term, crime has fallen, but some crimes have risen slightly in the previous 12 months.
Released: 26 April 2018
Police recorded 7,130 (22%) more crimes involving weapons, with knife crime in cities rising most.
Released: 26 April 2018
| Year | UK Population | 0 to 15 years (%) | 16 to 64 years (%) | 65 years and over (%) |
|---|---|---|---|---|
| 1975 | 56,226,000 | 24.9 | 61.0 | 14.1 |
| 1985 | 56,554,000 | 20.7 | 64.1 | 15.2 |
The police recorded 39,598 offences involving a knife or sharp instrument in the year ending December 2017. This is a 22% increase compared with the previous year (32,468), and the highest number in the seven-years' of available data.